Flexible Reporting in SAP Simple Finance
The Universal Journal provides the raw data for operational reporting, but SAP Simple Finance offers new capabilities for reporting on top of the Universal Journal. To introduce them, we will start the chapter with the reports that every project delivers as part of the first implementation: the financial statements, basic asset and inventory reporting, and basic management reporting. (Understanding how to get to these reports will also show how SAP Simple Finance offers innovation without disruption!) With SAP Simple Finance, you still have financial statements, basic asset reports, and so on as before thanks to the compatibility views that select data according to the fields in the old aggregate tables—but you also have the option of getting far greater insight from what is essentially the same raw data: the fields that were available in the line items but not in the aggregates.
To understand this switch, consider the P&L statement. We are all used to seeing an account structure grouped by company code, perhaps with the option to drill down by segment, profit center, or functional area. Now, imagine that instead of only seeing such a broad P&L statement you could focus on each of the account groups in turn and understand the business transactions behind the values shown on those accounts.
You might start by selecting a group of salary accounts and pulling in the cost centers for the employees for whom these salaries were paid or by looking at a group of material accounts and pulling in the projects and orders for which these materials were procured. This would show you which parts of your organization were responsible for certain spend categories. Imagine being able to select a group of revenue accounts and viewing the regions, products, and customers behind these postings. This would show you which parts of your organization were responsible for generating revenues.
Although we have had this information in the past, companies had to look for it across components. For example, to understand the details of the revenues, you had to choose a report in Profitability Analysis; to understand the costs, a report in Cost Center Accounting; and so on. Now, one report can take you from the aggregated P&L statement showing the financial health of the company as a whole to a deep dive that shows which regions are spending heavily and which are earning high revenues. If you pull in the planned costs for these items, then you will start to understand where you are meeting your targets and where you have a challenge.
Of course, there’s more to it than integration. The salary costs, for example, don’t generally remain salary costs but get charged in the form of allocations, building up sender–receiver relationships in which the cost centers are credited and, for example, the orders or projects debited as costs flow through the organization. Thanks to the design change whereby secondary cost elements are treated as part of the chart of the accounts, the new reports include these postings, so you’ll be able to track how overhead costs are gradually converted to cost of goods sold or assets under construction. In the past, organizations remained in the dark until period close, when order and project settlement moved overhead costs to the appropriate part of the balance sheet.
We’ll now look at the current challenges in operational reporting and how SAP Simple Finance provides a host of new options. We’ll look at changes to our understanding of accounts, how to group accounts, cost centers, and profit centers, and what this all means from an end user perspective.
1.1 The Challenge of Flexible Operational
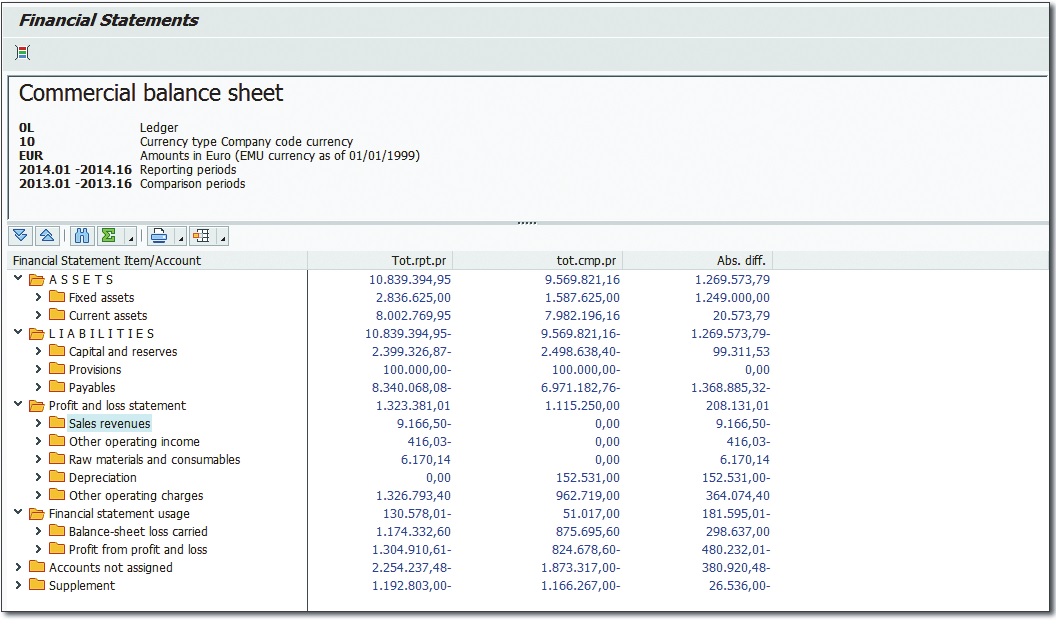
Reporting Needs Everybody who has used SAP ERP Financials has worked with a financial statement report like the one shown in Figure. It shows the accounts structured by the groups in the financial statement structure.
Such a report is the heart and soul of financial reporting and won’t disappear. Compatibility views on the old totals tables will ensure that no matter what version of this report your organization is currently using you will still see the same data in these reports as before. The challenge with a report like this is that it shows highly aggregated data, giving you a good overview but not much insight into what business events are driving the various postings
In this context, we have to think about potential drill-down options. If you were using the G/L, then it was already possible to take this same report and drill down by segment, profit center, functional area, and so on without navigating to a different report. You could, of course, have extended the G/L to include further dimensions in this table, but due to the technical limitations outlined. most organizations would not have added more than a handful of custom fields. If you only used cost centers, then it made sense to activate the cost center scenario for the G/L.
In previous releases, this required building your own reports to look at the costs by cost center. More often than not, organizations wouldn’t go down that track at all, because they also use orders, work breakdown structure (WBS) elements, business processes, and so on to collect costs, and these weren’t available as G/L scenarios. Instead, they would report in the Controlling module, thereby moving into a different world in terms of the type of reports offered and the granularity of the information available. Figure shows a classic cost center report displaying the following costs:
- Costs that were posted directly to the cost center (salaries, buildings, insurance, and so on)
- Costs that this cost center received from other cost centers (cafeteria, telephones, and so on)
- Costs that it charged to other cost centers in the form of an allocation for corporate service costs
This is typical of the object-focused reporting we typically know in Controlling, in which the assumption is that one manager is responsible for all costs on his cost center.
The working assumption behind this kind of report is that when the cost center manager notices an anomaly—for example, that actual costs that are hugely different from the planned costs—then he will select the offending line and navigate to the relevant line items to understand what exactly has been going wrong. Essentially, what he does here is leave the report and navigate to another one via report–report interface. We have all been conditioned to do this, because the totals records only contain a handful of fields (the cost center, the cost element, the period, and so on).
The challenge with such reports is that in order to see the materials that were ordered, the employee submitting travel expenses, or indeed most of the detail that tells a manager what really happened, the manager has to navigate away from the overview report and down into the line items without fine-grained control of the filter criteria, due to the coarse-grained overview report. This leads to the risk that he will be overwhelmed by the sheer number of detailed line items, not all of them relevant to his cause.
More to the point, a report like this forces a manager to think in period blocks. If he is looking at orders or projects that often exist over multiple periods, then he has to be careful about the time frame he selects, because orders and projects rarely fit neatly into the year viewed in P&L statements, and it is easy to start comparing apples with pears if you have orders and projects that run over several years.
The financial statements and the cost center report thus outlined represent business as usual. Let’s turn our attention to how operational reporting changes with SAP Simple Finance and solves the challenges and information needs mentioned so far, thanks to the new possibilities from SAP HANA and the Universal Journal.
1.2 Conceptual Advances in Reporting
As we start to bring together financial data that has long been kept apart, it’s also important to consider the organizational structure of this data. Thanks to the Universal Journal, SAP Simple Finance can overcome conceptual limitations of the past. The handling of entities relevant for organizing reporting has been enhanced to make the conceptual setup of reporting easier. We will look at the most important entities—namely, accounts and hierarchies—ahead.
Students starting out in Controlling learn that P&L accounts are primary cost elements and that whenever they need to document a cost flow they are working with secondary cost elements. SAP Simple Finance removes what many people consider this unnatural distinction, treating cost elements and accounts as one and the same. Working with hierarchies of accounts, cost centers, and other entities is now simpler because of this unification.
1.3 Advances for End Users
SAP Fiori is the umbrella term for the new UI of SAP Simple Finance (and other SAP products).
Figure shows My Spend, one of the first SAP Fiori applications. It gives managers on the move access to their spending on a tablet or mobile device as well as on the more traditional desktop. Here, we see the manager’s spending grouped by cost center group, with the relative size of each box being determined by the total spend for each cost center. To see the details, users click on the box to show the actual costs, the committed costs (for open purchase orders), and the budget. From there, users can access the details for each account group and finally navigate from there to the line items.
Alternatively, you can view the way different account groups are trending. At the beginning of the year, when little has been spent, you can switch to Budget to see the relative budget per cost center. Based on these features, the My Spend app gives managers with busy schedules full control over their spending at any time and enables them to react early
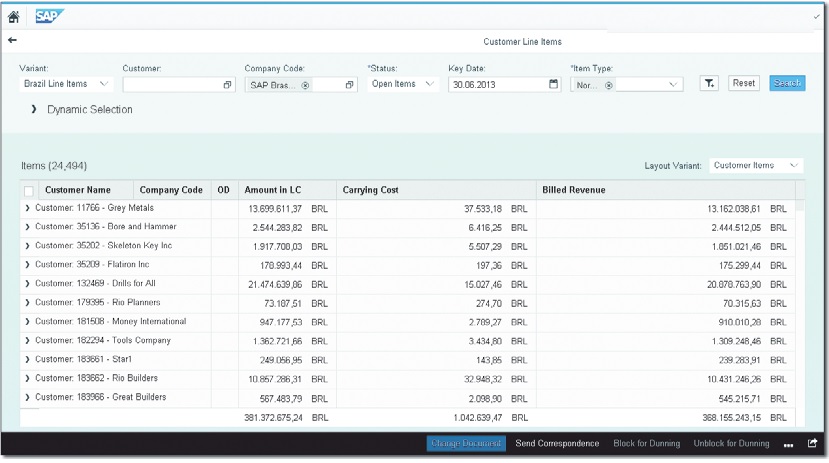
Another paradigm shift in SAP Simple Finance has been to redefine selection screens. Figure shows the SAP Fiori version of the customer line items report. Notice the selection boxes across the top of the screen and the Filter but- ton next to the Reset button that allow you to add more selection fields as required. The simple act of including the selection screen in the main screen of the report makes working with such a report much easier, because you no longer have to back out of the report to change the selection criteria.
This Information is publish by SAPVITS.
We are leading SAP Online Training Company, We Provide SAP S4 HANA Simple Finance Online Training, SAP Fiori Online Training, SAP S4 HANA Simple Logistics Online Training
SAPVITS is Pune based company Providing SAP Online Training in Pune, SAP training in Chennai, SAP Training in Hyderabad